

Live3 · Interface guide
Dashboard
The first screen after signing in.
The first screen after signing in. It shows a live tile for every parameter the selected station reports, each with its latest value and today's range, so you can read a station at a glance.
How to get there. It's the home screen. Sign in, or choose Dashboard in the left navigation from anywhere.
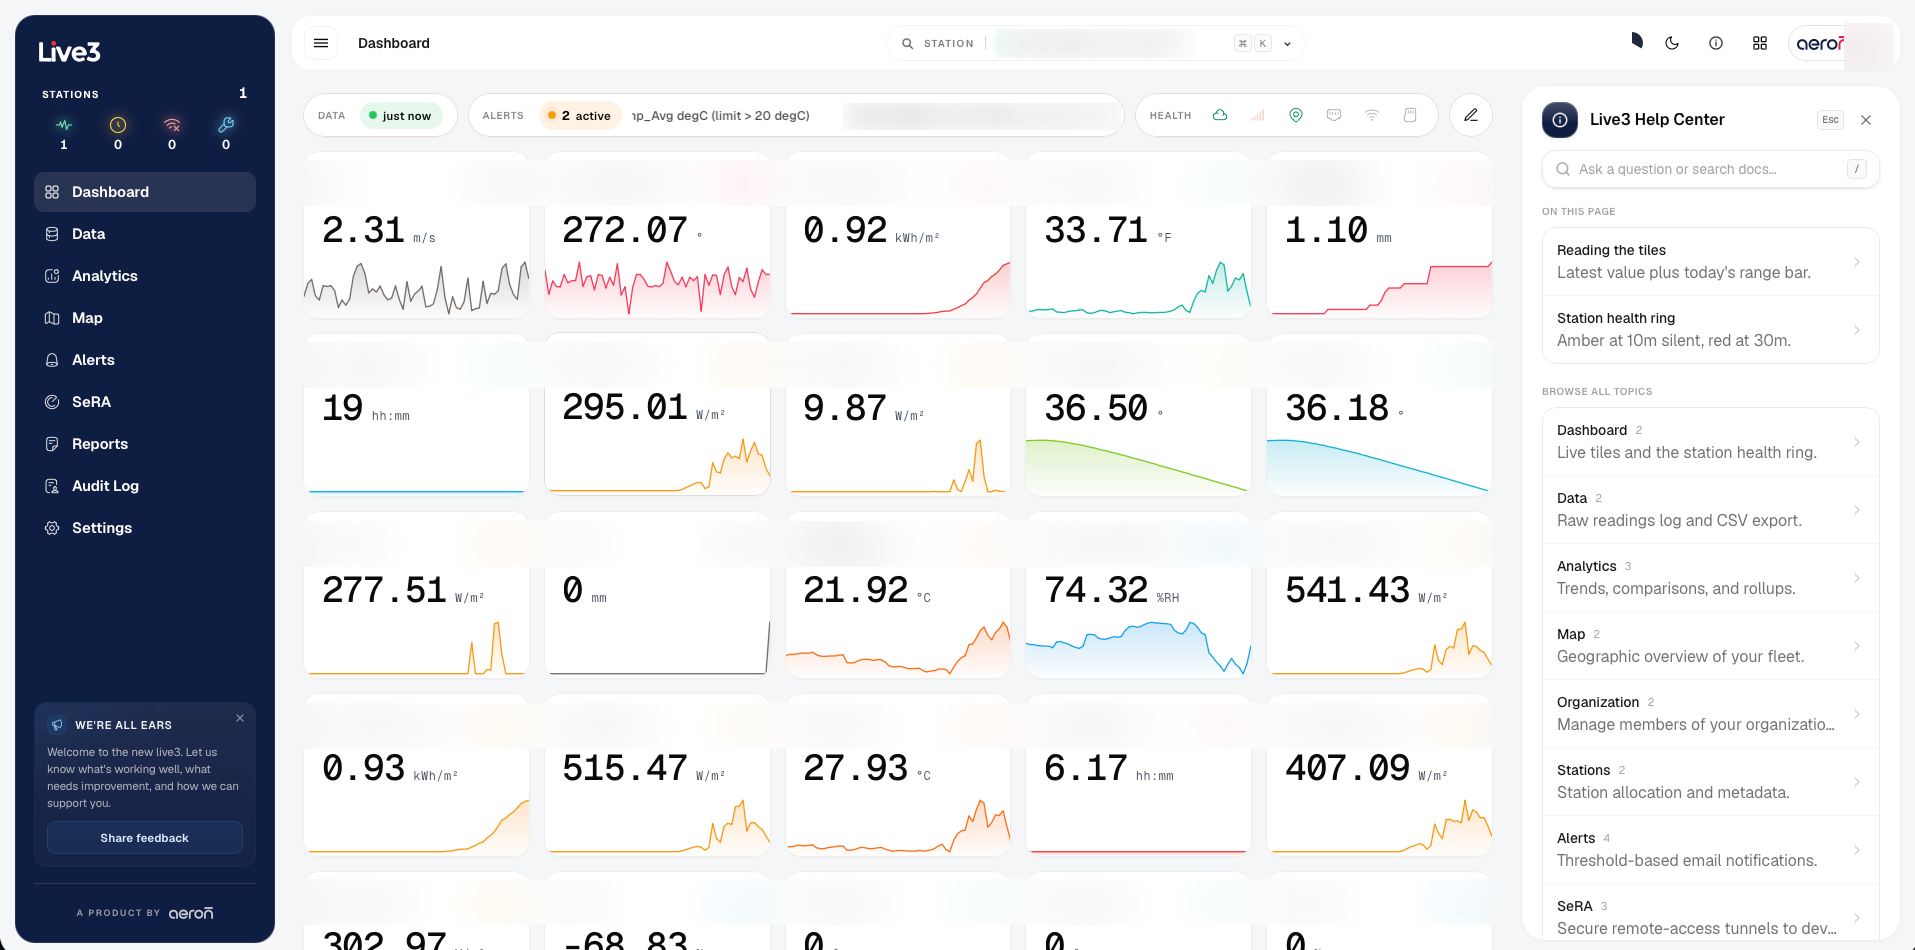
Key areas
| # | Area | What it does |
|---|---|---|
| 1 | Left navigation | Move between Dashboard, Data, Analytics, Map, Alerts, SeRA, Reports, Audit Log and Settings. |
| 2 | Station switcher | Pick which station fills the tiles, from the top bar. |
| 3 | Live tiles | One per parameter: the latest value plus today's range bar. |
| 4 | Station health | Freshness and signal chips; they turn amber at 10 minutes silent and red at 30. |
| 5 | Help center | Search the docs or ask a question without leaving the app. |
Related
- Interface guide — every screen in one place
- How-to guides — tasks that span screens