

Wedant · docs
Interface guide
A tour of the app, one screen at a time.
Wedant is one workspace with a handful of screens. This is what each one is for; use it when you are looking at the app and want to know what a screen does.
Trying to accomplish a task that spans screens? See the How-to guides.
Dashboard
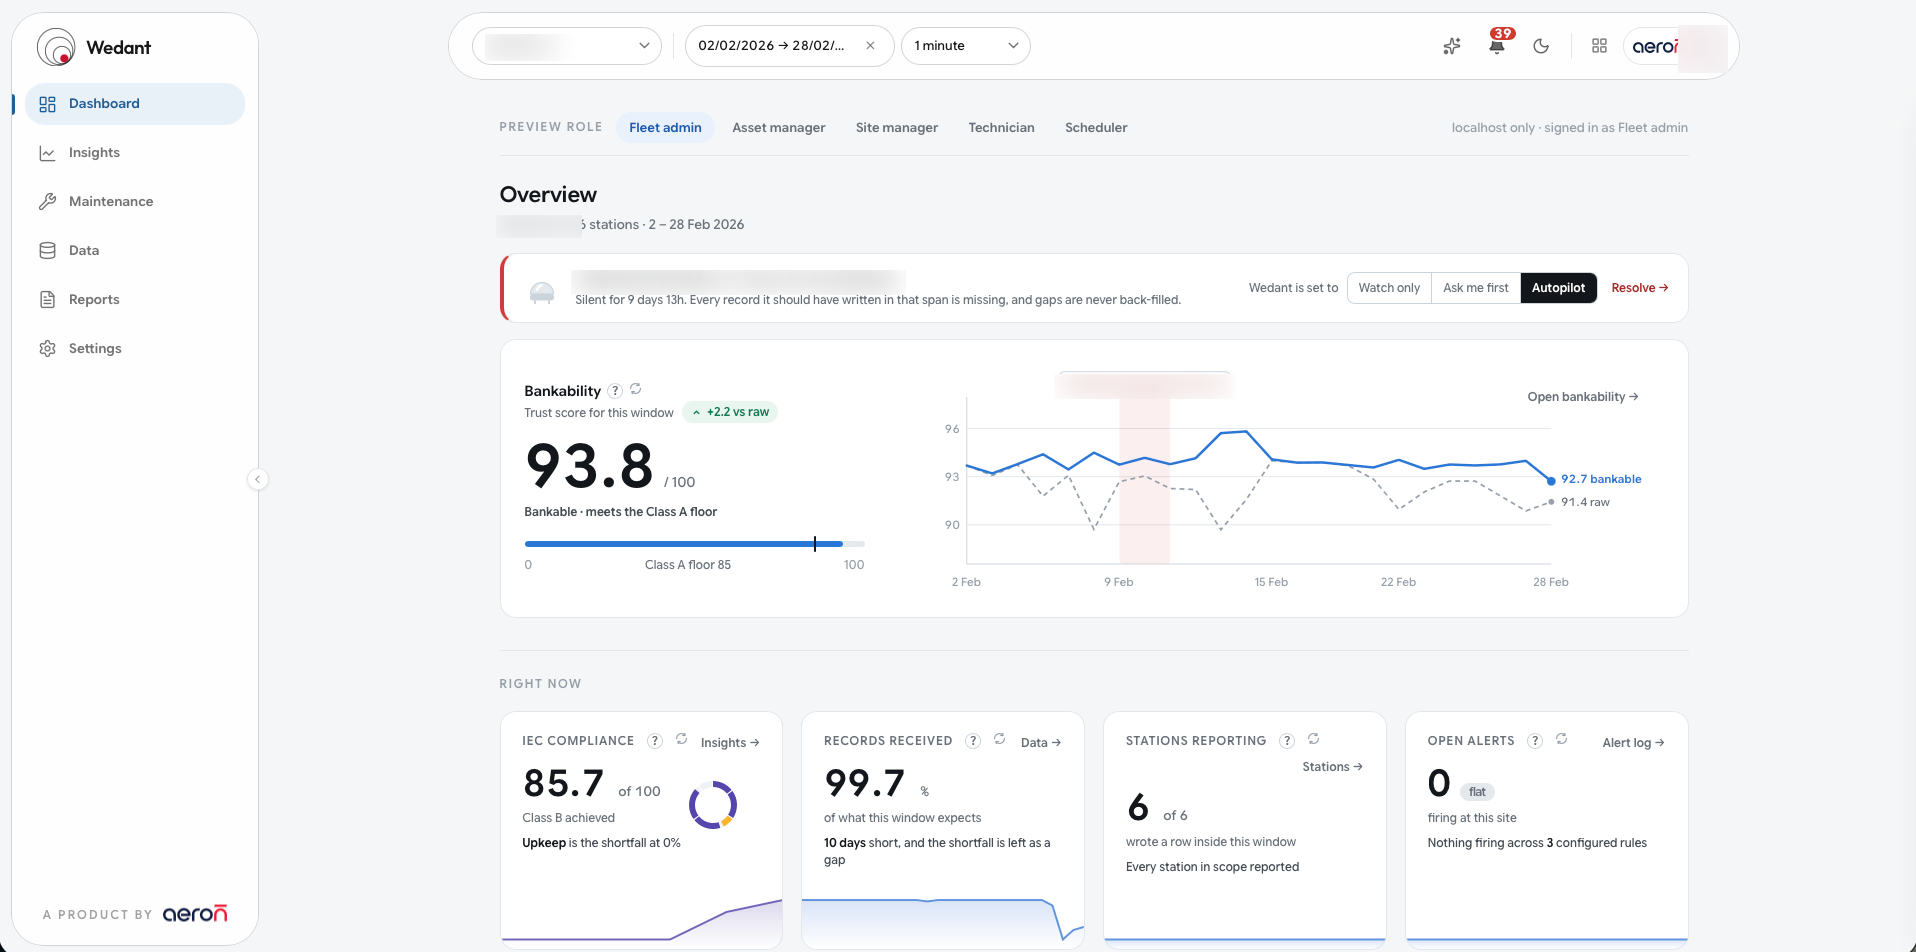
The fleet overview and the screen you land on. Your sites are ranked by clear-sky index, worst first, with the live fleet map colour-coded by data trust. A built-in assistant answers plain questions about the fleet, like "Why is my bankability score like this?" and "What should I act on first?".
Insights
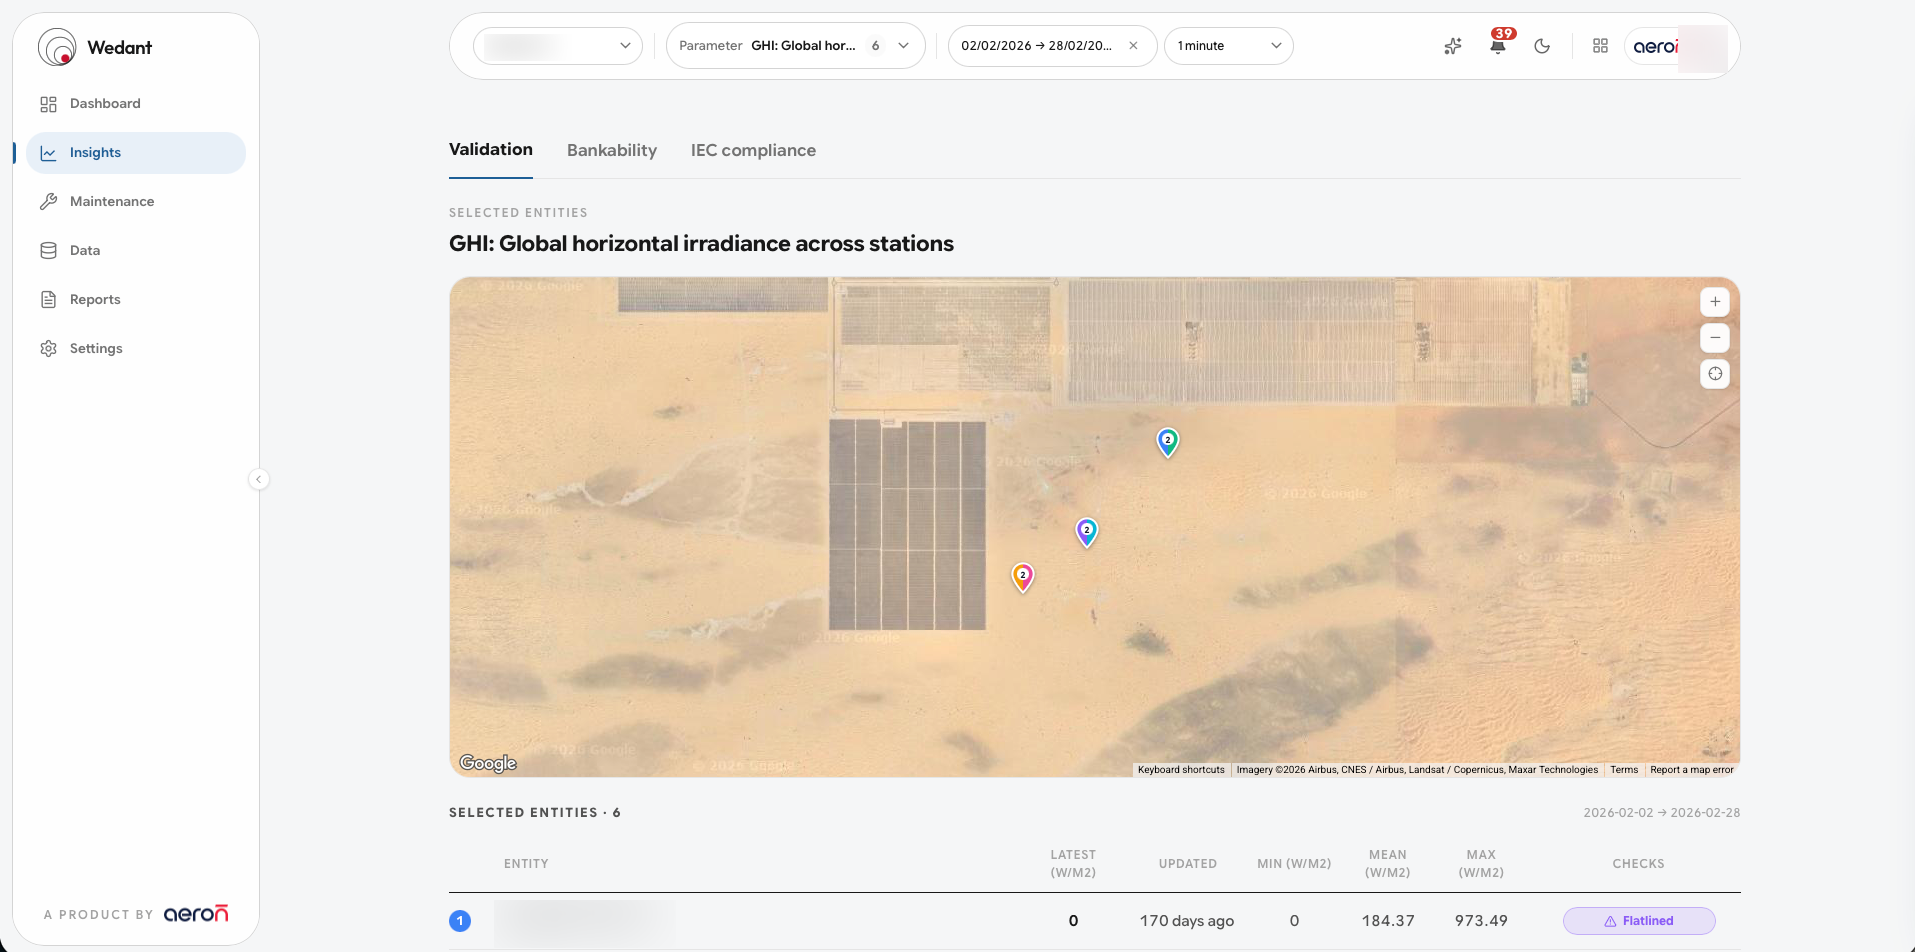
The deeper analytical view. Replay any historical window to see exactly when a sensor drifted, how the score responded, and what it cost, station by station.
Maintenance
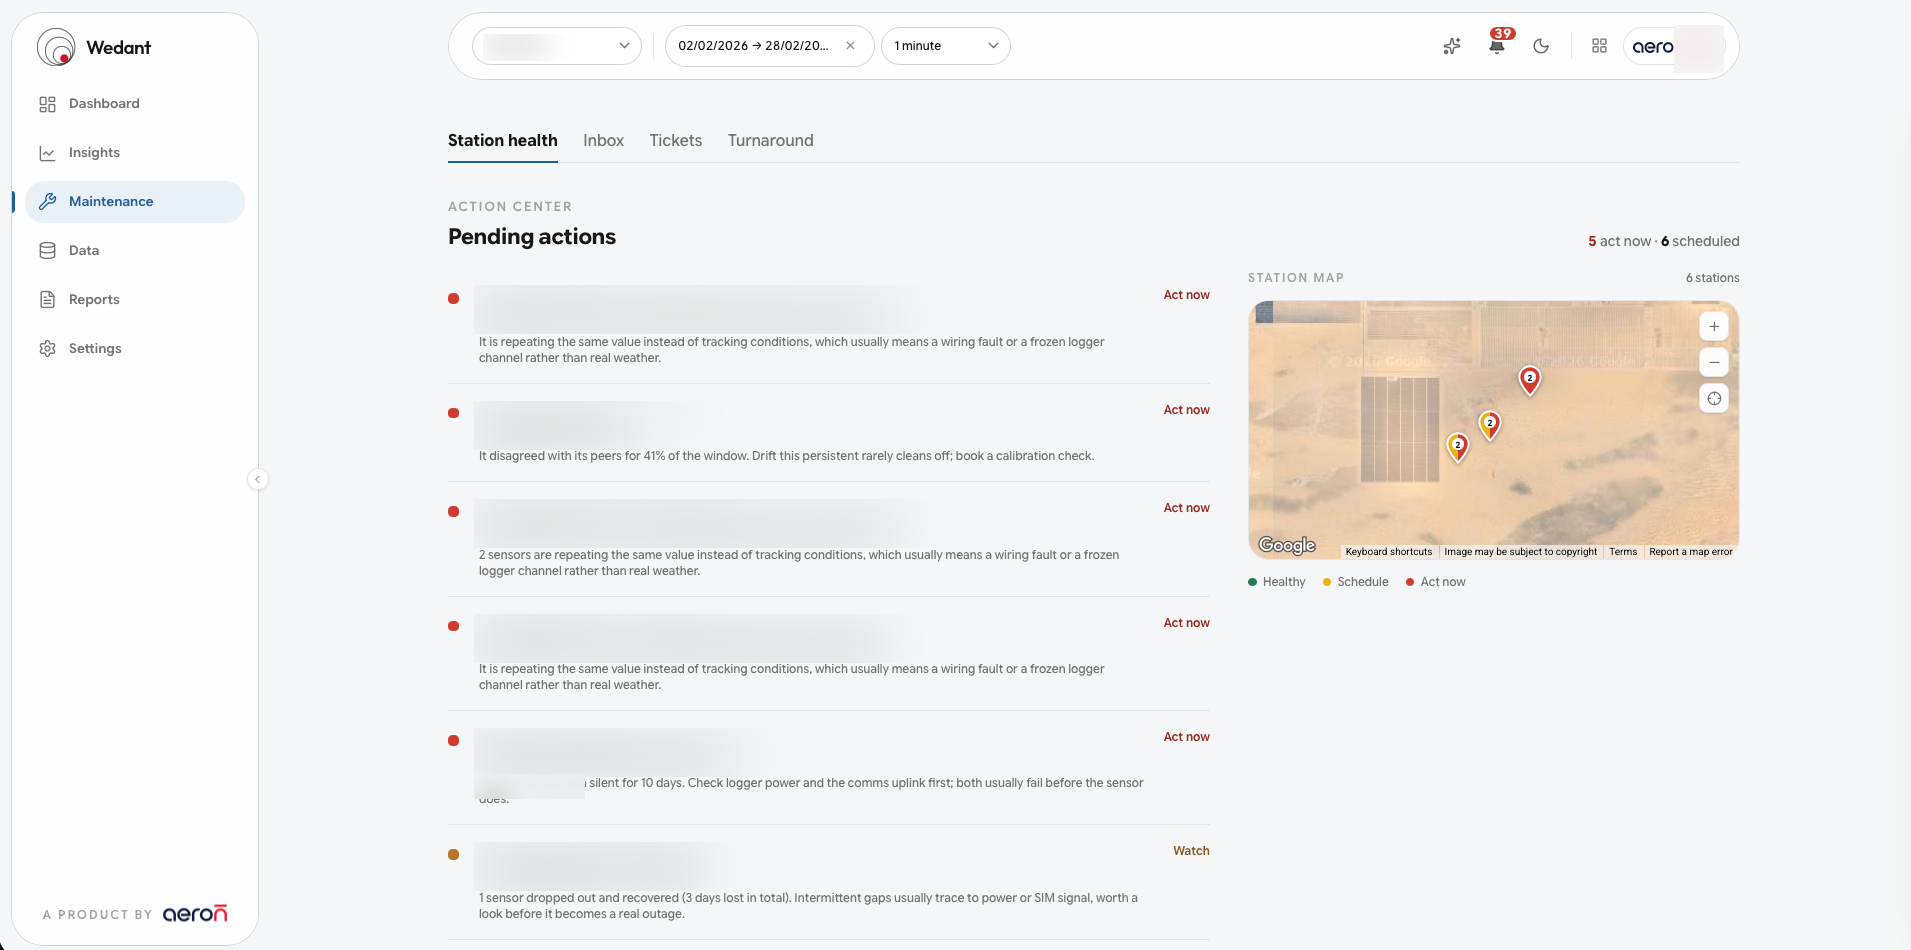
Station health and the work that keeps it up. See open problems, record what you did as a disposition (for example "I cleaned all sensors today"), and keep a log of maintenance so the score and problem list stay honest.
Data
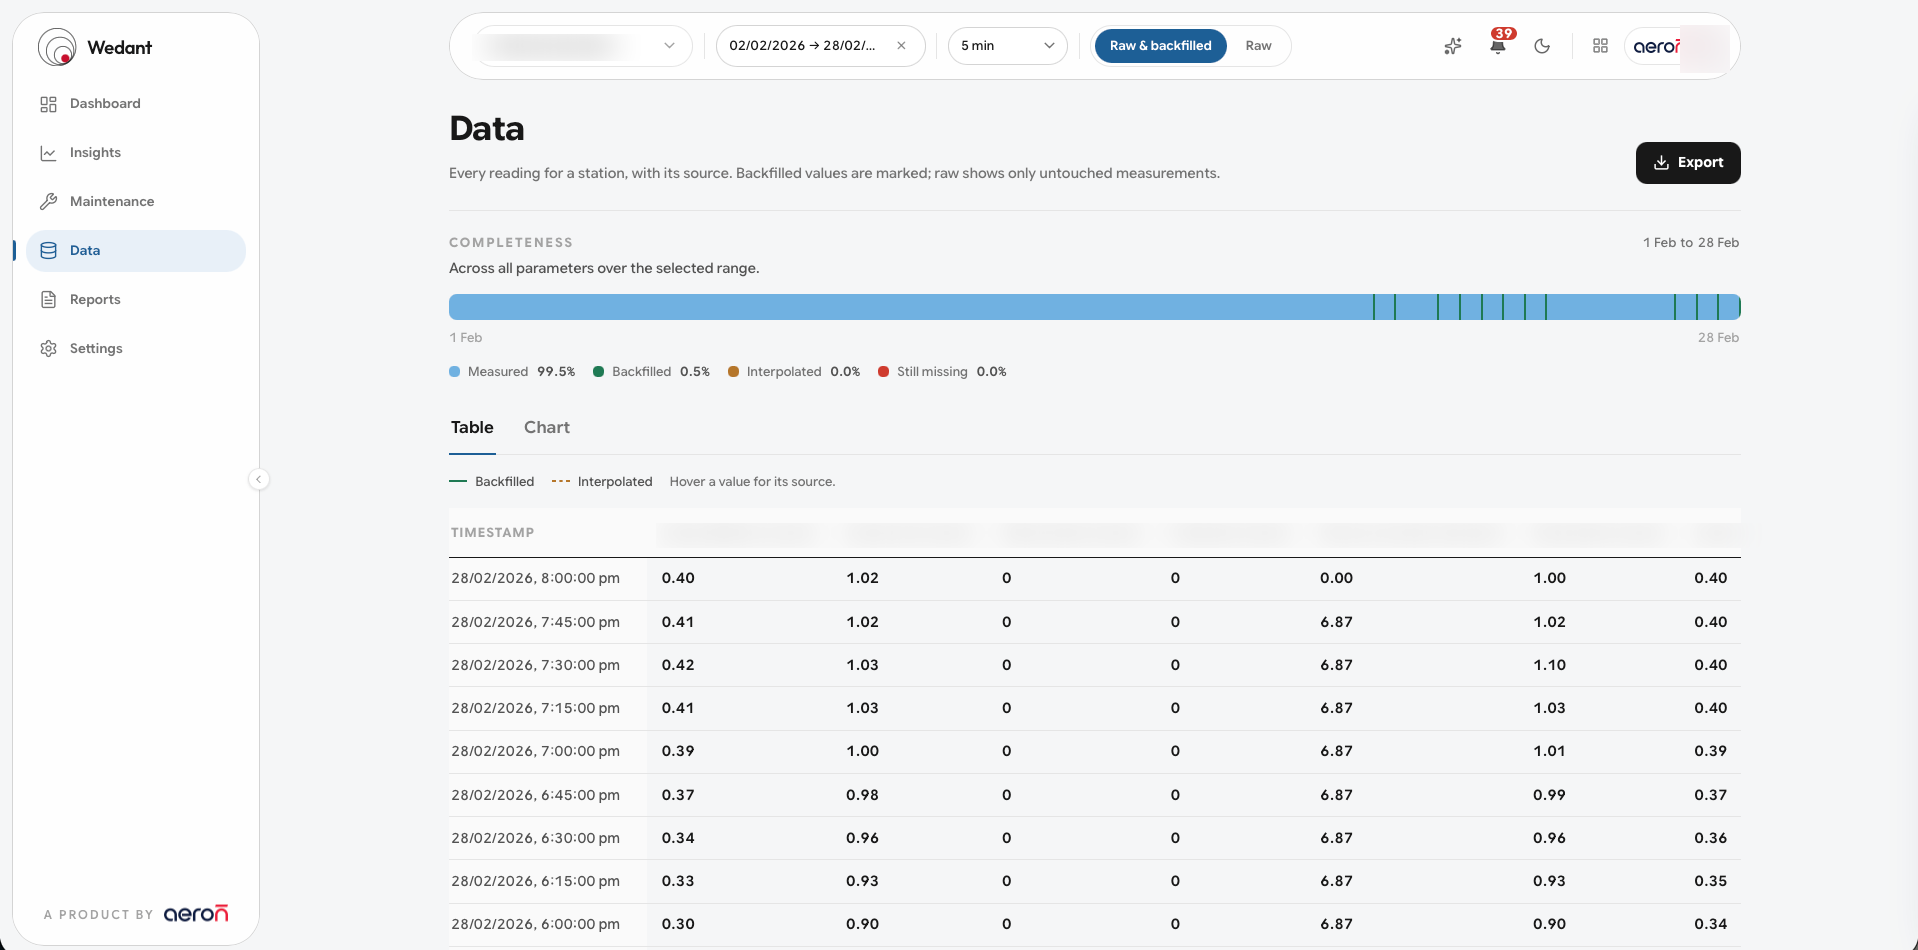
Browse and export your data. Choose the dataset, the delivery, and whether it repeats. Every value shows its provenance: hover a reading to see its source.
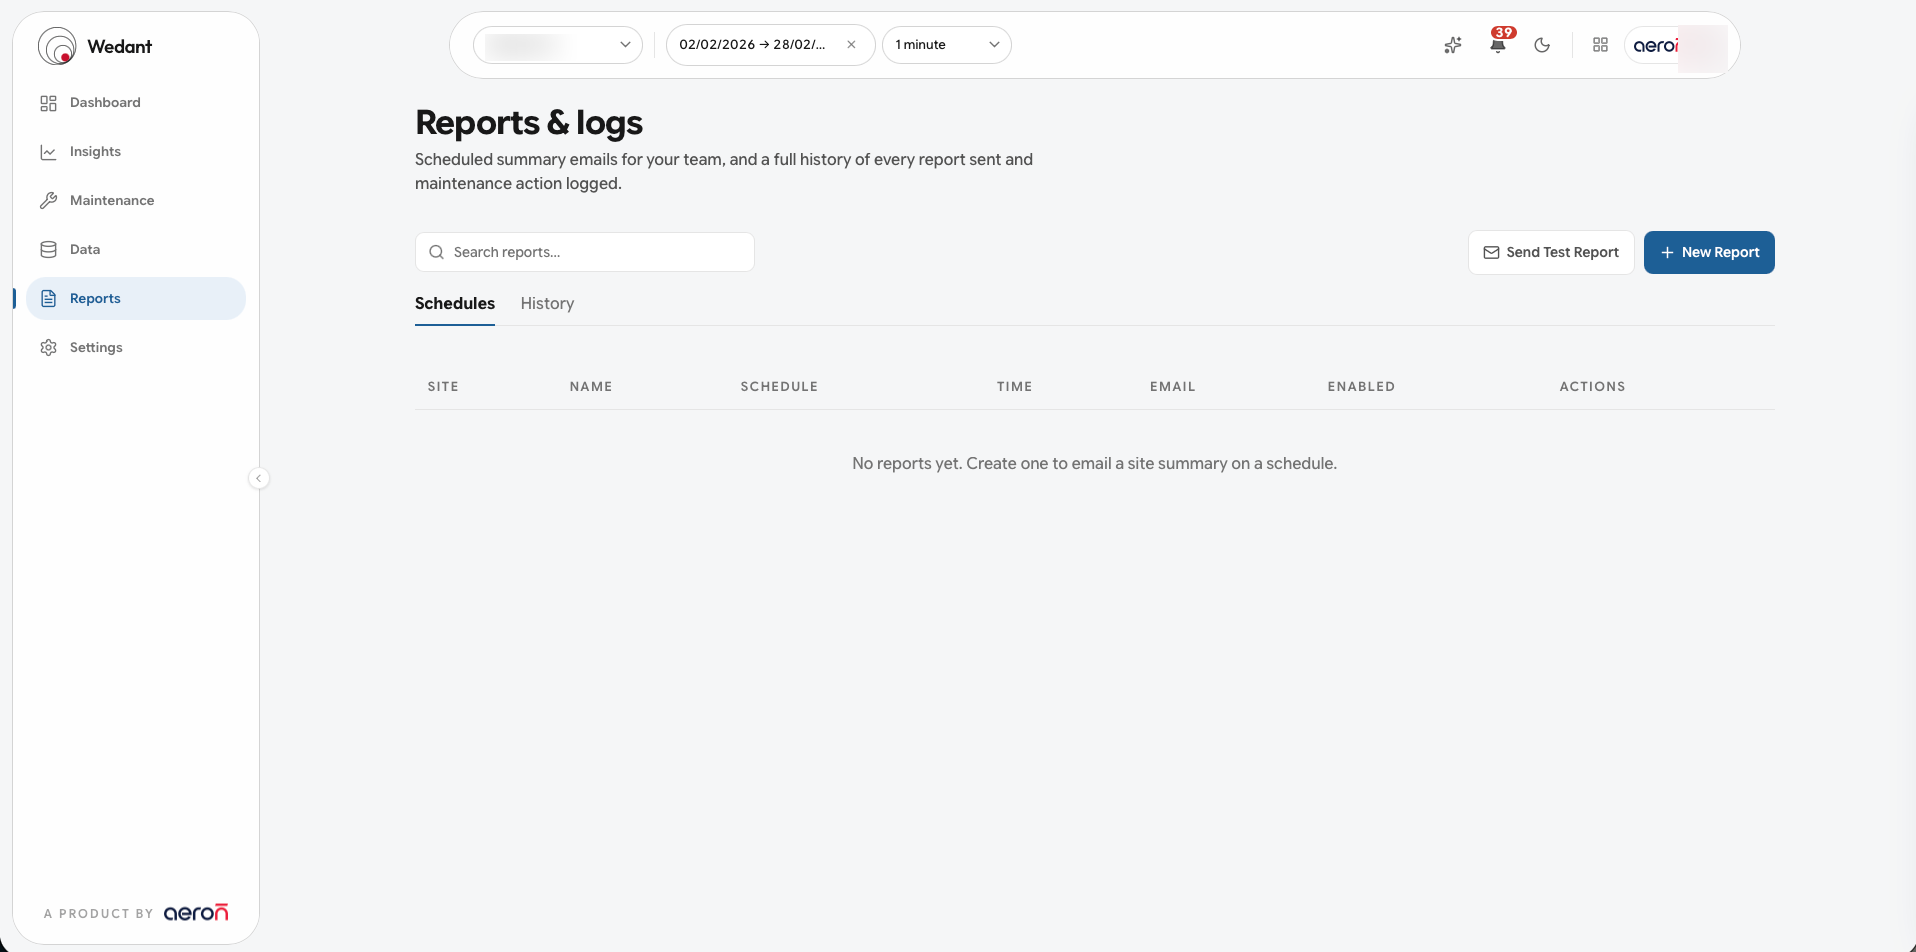
Reports
Smart alerts and scheduled reports. Get told the moment a sensor flatlines, drops, or diverges from its neighbours, and set recurring reports to land where your team already works.
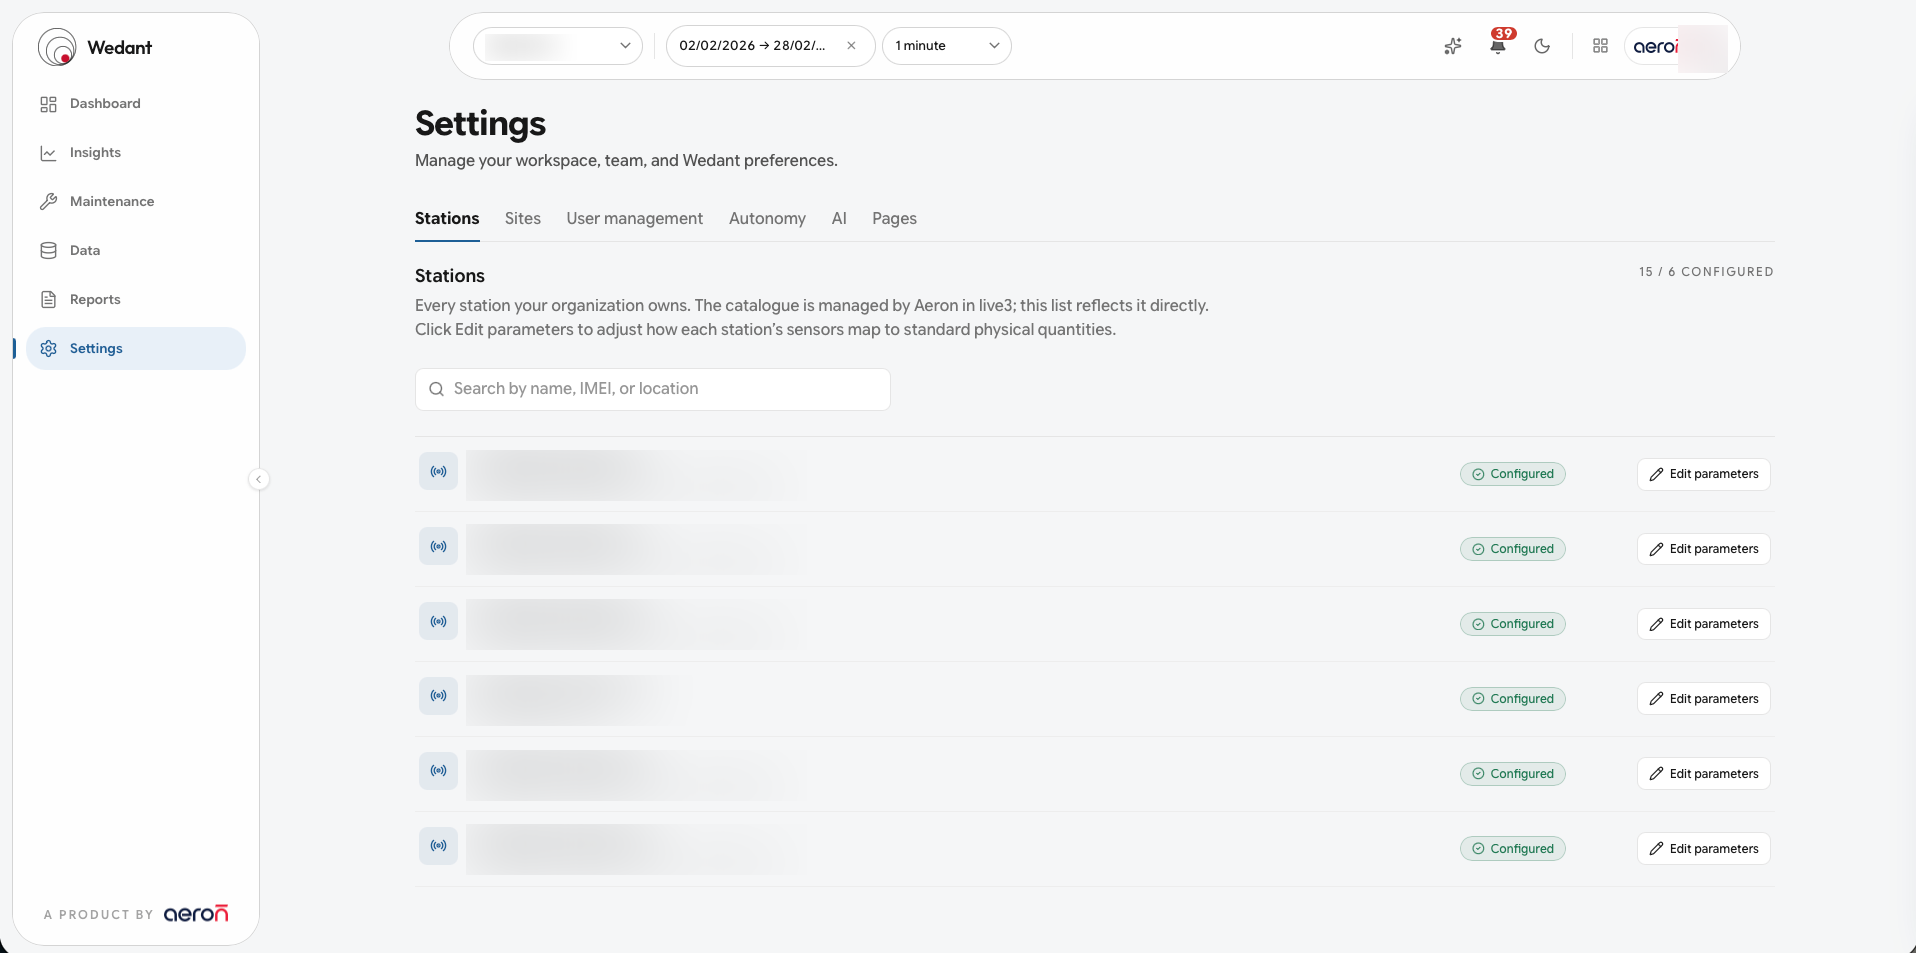
Settings
Manage your workspace: your sites and stations, parameter mappings, and who has access.
Each screen above is shown as it appears in the app.